Apache writes everything you need to know about your traffic — top URLs, status code breakdown, suspicious bot activity — straight into access_log. Reading it raw with tail tells you almost nothing useful past the first dozen lines. GoAccess (created and maintained by Gerardo Orellana) is a tiny C binary that parses those logs and renders a single self-contained HTML dashboard. No daemon, no database, runs in under 10 MB of RAM.
This guide walks through installing GoAccess on a Bitnami WordPress instance running on AWS Lightsail, scheduling the report regeneration, and protecting the URL with HTTP basic auth. The commands are run from WSL2 Ubuntu on Windows over SSH, but they work the same on any Ubuntu host.
Prerequisites
- An Apache server writing access logs (Bitnami WordPress on Lightsail in this example) — see How to Install Apache 2.4 Web Server on EC2 Ubuntu 22.04 LTS if you need one
- SSH access to the server with
sudo - HTTPS already configured — see How to Secure Apache2 with Let’s Encrypt on Ubuntu 22.04 if not — because the dashboard is going to be served over the public web
Step 1: Install GoAccess
sudo apt-get update
sudo apt-get install -y goaccess
goaccess --version | head -1
Ubuntu 20.04 ships GoAccess 1.4. Newer versions (1.7+) have nicer output and a few more report panels — if you want the latest, build from the GoAccess website’s APT repo. The 1.4 version on default Ubuntu is fine for getting started.
Step 2: Identify Your Apache Log Format
GoAccess needs to know which fields each log line contains. Bitnami Apache uses the common log format by default, not combined. You can confirm by inspecting a line:
sudo head -1 /opt/bitnami/apache/logs/access_logA common-format line looks like this — note there is no referer or user-agent at the end:
198.51.100.42 - - [27/Apr/2026:00:00:15 +0000] "GET / HTTP/1.1" 200 27088If your log lines end with the referer URL and a user-agent string, you have combined format. Pass --log-format=COMBINED instead of --log-format=COMMON in every command below.
Step 3: Generate the First Report
Render the dashboard once to confirm the format is right and the output looks good.
sudo goaccess /opt/bitnami/apache/logs/access_log \
  --log-format=COMMON \
  -o /opt/bitnami/wordpress/status.html \
  --no-progress \
  --ignore-crawlers \
  --anonymize-ip
sudo chown daemon:daemon /opt/bitnami/wordpress/status.html--ignore-crawlersfilters out known bot user-agents — useful for getting a real picture of human traffic--anonymize-iptruncates the last octet of every visitor IP — recommended if you publish the dashboard URL anywhere--no-progresssilences the parsing progress bar (cron-friendly)- The
chownhands ownership todaemon(Bitnami’s Apache user) so the file is served cleanly
Browsing to https://example.com/status.html at this point would already work — but the dashboard would be public, and that exposes visitor data and admin paths. Locking it down comes in Step 5.
Step 4: Schedule Automatic Regeneration
A static HTML report is only useful if it is current. Drop a cron file that rebuilds it every 15 minutes.
sudo tee /etc/cron.d/lb-goaccess >/dev/null <<'EOF'
*/15 * * * * root /usr/bin/goaccess /opt/bitnami/apache/logs/access_log --log-format=COMMON -o /opt/bitnami/wordpress/status.html --no-progress --ignore-crawlers --anonymize-ip >/dev/null 2>&1 && chown daemon:daemon /opt/bitnami/wordpress/status.html
EOF
sudo chmod 644 /etc/cron.d/lb-goaccess
Files in /etc/cron.d/ are picked up automatically by cron; no service restart is needed. The job runs as root because access_log is only readable by root and daemon.
If you want to include all rotated logs (older traffic that has been gzipped), pipe them through zcat first:
*/15 * * * * root zcat -f /opt/bitnami/apache/logs/access_log* | /usr/bin/goaccess - --log-format=COMMON -o /opt/bitnami/wordpress/status.html --no-progress --ignore-crawlers --anonymize-ip && chown daemon:daemon /opt/bitnami/wordpress/status.htmlStep 5: Protect the URL with HTTP Basic Auth
The dashboard contains visitor IPs, the URLs of admin pages, and request volume — none of which should be public. Add a few lines to the WordPress .htaccess to require authentication on that one file.
sudo tee -a /opt/bitnami/wordpress/.htaccess >/dev/null <<'EOF'

# Protect GoAccess status report
<Files "status.html">
    AuthType Basic
    AuthName "Status"
    AuthUserFile "/opt/bitnami/apache/conf/status.htpasswd"
    Require valid-user
</Files>
EOF
Now create the credentials file. The -c flag creates a new file (drop it on subsequent runs to avoid overwriting):
sudo htpasswd -c /opt/bitnami/apache/conf/status.htpasswd admin
sudo chown root:daemon /opt/bitnami/apache/conf/status.htpasswd
sudo chmod 640 /opt/bitnami/apache/conf/status.htpasswd
The ownership of root:daemon with 640 means only root and the Apache user can read the file — never world-readable. htpasswd will prompt twice for the password and store it as a bcrypt-hashed entry.
Step 6: Verify
curl -sI https://example.com/status.html | head -2Expected response — anything else means Apache hasn’t picked up the .htaccess change:
HTTP/2 401
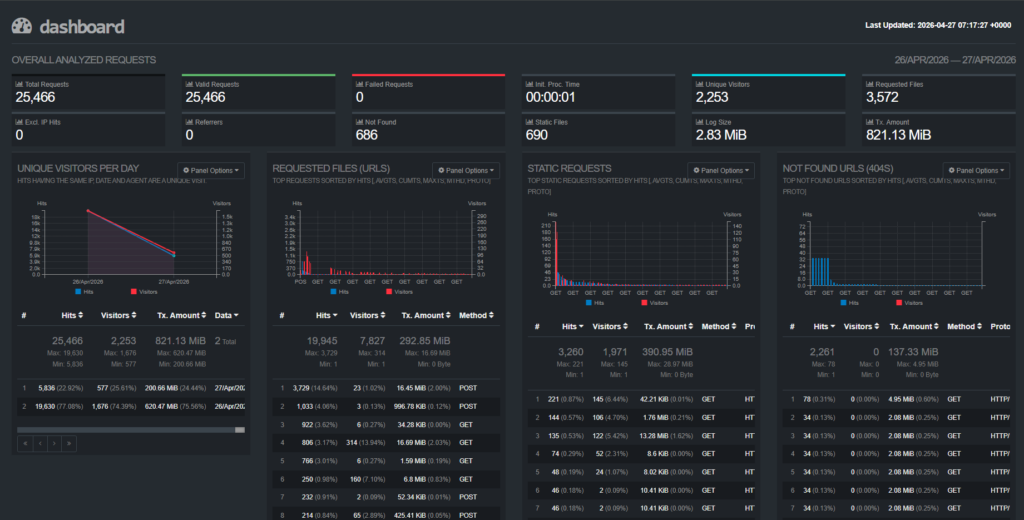
www-authenticate: Basic realm="Status"Open https://example.com/status.html in a browser, enter your credentials, and you’ll see the dashboard: top URLs, status code breakdown, hourly traffic, top user agents, geographic origin, and slowest requests — all on one self-contained HTML page.
Example:
Common Issues
| Symptom | Likely cause | Fix |
|---|---|---|
Token for '%b' specifier is NULL | Wrong log format flag | Switch --log-format=COMBINED to COMMON (or vice versa) based on the actual log lines |
| Dashboard timestamp not updating | Cron not firing, or GoAccess hitting a parse error | sudo grep CRON /var/log/syslog | tail and run the goaccess command manually to see the error |
| HTTP 500 instead of 401 on the URL | htpasswd file missing or unreadable to daemon | Re-run chown root:daemon and chmod 640 on the htpasswd file |
| Empty report (“no entries found”) | Apache logging to a different path, or log rotation just truncated the file | Verify the access_log path in the cron command exists and has recent lines |
Step 7: Add an Error Log Dashboard
GoAccess only parses access logs. The error log is a different file in a different format — free-form messages from Apache itself, PHP, and modules like mod_security — and GoAccess will not render a dashboard for it. But the same pattern from this guide (a script + cron + .htaccess auth) gives you a companion dashboard for errors using nothing but standard Linux utilities.
Write a small bash script
Save the following as /usr/local/bin/error-report.sh. It aggregates the error log into a static HTML page in the WordPress root.
#!/bin/bash
set -e
LOG="/opt/bitnami/apache/logs/error_log"
OUT="/opt/bitnami/wordpress/errors.html"
# HTML-escape arbitrary log content before embedding
esc() { sed -e 's/&/\&/g; s/</\</g; s/>/\>/g'; }
GENERATED=$(date '+%Y-%m-%d %H:%M:%S %Z')
TOTAL=$(wc -l < "$LOG")
DENIED=$(grep -c 'client denied' "$LOG" || true)
REAL=$((TOTAL - DENIED))
TOP_TYPES=$(awk -F'] ' '/^\[/ {print $2}' "$LOG" | awk '{print $1}' \
| sort | uniq -c | sort -rn | head -10 | esc)
TOP_IPS=$(grep -hE 'client denied' "$LOG" \
| grep -oE 'client [0-9a-fA-F.:]+' | sort | uniq -c | sort -rn | head -10 | esc)
LAST_REAL=$(grep -v 'client denied' "$LOG" | tail -50 | esc)
cat > "$OUT" <<HTML
<!DOCTYPE html>
<html><head><meta charset="utf-8"><title>Error Log Summary</title>
<style>body{font-family:monospace;max-width:1100px;margin:2em auto;padding:0 16px}
pre{background:#fff;border:1px solid #e5e7eb;padding:12px;white-space:pre-wrap;font-size:.85em}
h2{margin-top:1.5em;border-bottom:1px solid #ddd;padding-bottom:4px}</style></head><body>
<h1>Apache Error Log Summary</h1>
<p>Generated $GENERATED · $TOTAL total / $REAL real errors / $DENIED bot probes</p>
<h2>Top error types</h2><pre>$TOP_TYPES</pre>
<h2>Top scanner IPs</h2><pre>$TOP_IPS</pre>
<h2>Last 50 real errors</h2><pre>$LAST_REAL</pre>
</body></html>
HTML
chown daemon:daemon "$OUT"Make it executable and run it once:
sudo chmod +x /usr/local/bin/error-report.sh
sudo /usr/local/bin/error-report.sh
ls -lh /opt/bitnami/wordpress/errors.html
Add it to cron and protect the URL
Append a second job to the cron file from Step 4. Offset by a few minutes so the two reports do not run at the same time:
5-59/15 * * * * root /usr/local/bin/error-report.sh >/dev/null 2>&1And add a second <Files> block to the .htaccess from Step 5 — reusing the same htpasswd means one credential set covers both dashboards:
<Files "errors.html">
AuthType Basic
AuthName "Status"
AuthUserFile "/opt/bitnami/apache/conf/status.htpasswd"
Require valid-user
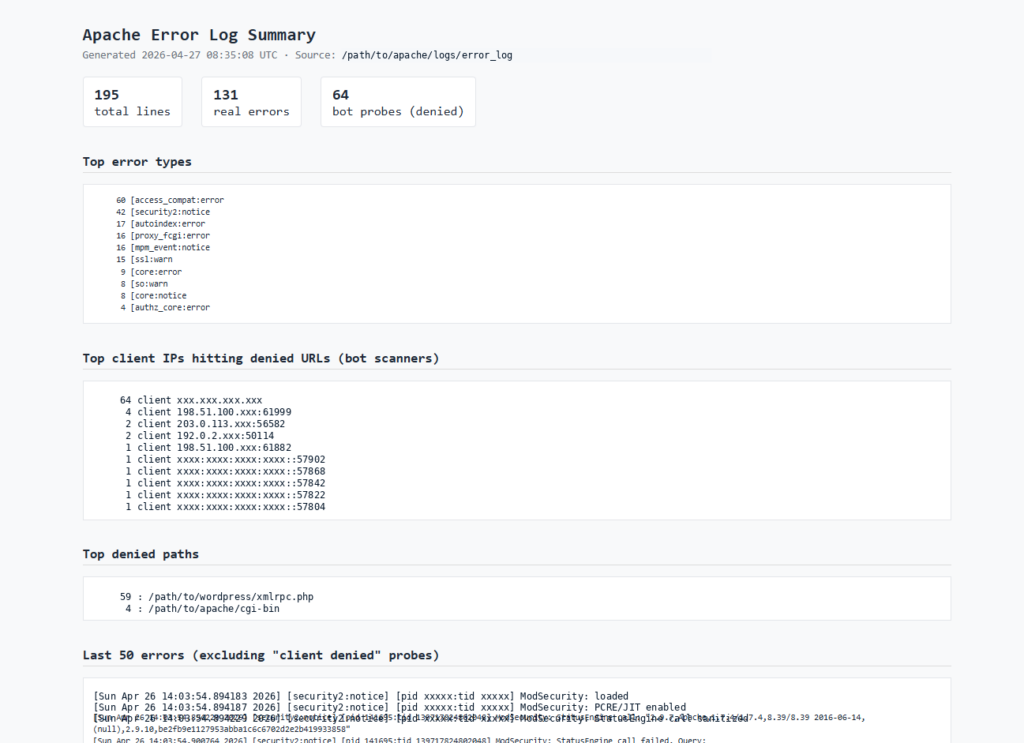
</Files>Browse to https://example.com/errors.html, sign in with the same credentials as the GoAccess dashboard, and you will see top error types, top scanner IPs, and the last 50 real errors with the noise filtered out.
Example:
CLI alternatives for ad-hoc inspection
The dashboard is great for a quick at-a-glance view, but for live tailing during an incident, drop straight to the shell:
# Live tail, skipping bot scanner noise
sudo tail -f /opt/bitnami/apache/logs/error_log | grep -v 'client denied'

# Last 50 real errors right now
sudo grep -v 'client denied' /opt/bitnami/apache/logs/error_log | tail -50
For passive monitoring without checking any dashboard, install Logwatch (sudo apt install -y logwatch) — it emails a daily summary of the error log. Pair it with a working SMTP relay (Amazon SES is a good fit on Lightsail) so the digest actually reaches your inbox.
Conclusion
You now have a real-time-ish view of who is hitting your server, what they’re requesting, and which paths are returning errors — all from a 10 MB binary, a single cron line, and one .htaccess stanza. No agent, no database, no monthly fee.
From here, the natural next steps are wiring up alerts on top of the same logs (a small journalctl + email cron is enough for most blogs) and structuring the data for richer queries — the post on parsing custom logs in Datadog using Grok rules is a useful next read if your traffic outgrows what a static HTML report can show.