NAT Gateways are one of the most overlooked cost drivers in AWS. At $0.045 per hour plus $0.045 per GB of data processed, a single NAT Gateway running 24/7 in one Availability Zone costs around $32/month before any traffic even flows through it. Add ECS containers pulling images, services calling S3, DynamoDB, and CloudWatch, and that number climbs fast. A $55K/year NAT Gateway bill is not unusual for teams running multiple VPCs with containerized workloads.
The problem is that AWS does not tell you what is generating the traffic. You get a line item on the bill, but no breakdown by service, subnet, or destination. This guide shows you how to enable VPC Flow Logs, query them with Amazon Athena, and deploy VPC Endpoints to eliminate unnecessary NAT Gateway charges. The examples in this guide are run on WSL2 Ubuntu in Windows using the AWS CLI, but they work the same on any Ubuntu system.
The Problem: No Visibility Into NAT Gateway Traffic
Before setting up flow log analysis, most teams have no answers to these questions:
- Why is the NAT Gateway bill so high?
- Which VPCs, subnets, or ECS services generate the most traffic?
- What traffic is being blocked by security groups or NACLs?
- Could VPC Endpoints eliminate NAT charges for S3, DynamoDB, and ECR?
VPC Flow Logs capture metadata about every network flow in your VPC. Combined with Athena, you can query terabytes of log data in seconds and pinpoint exactly where your money is going.
Prerequisites
- An AWS account with permissions to create VPC Flow Logs, S3 buckets, and Athena queries
- AWS CLI v2 installed and configured — see How to Install AWS CLI v2 on Ubuntu 22.04 if you need to set it up
- A VPC with at least one NAT Gateway (the one you want to analyze)
- An S3 bucket to store flow logs
- Basic familiarity with SQL (Athena uses standard SQL syntax)
How NAT Gateway Costs Add Up
Before we start fixing, here is why the costs get out of hand. Every byte that leaves a private subnet to reach the internet or an AWS service goes through the NAT Gateway, and you pay twice: once for the NAT hourly rate, and again for every GB processed.
Cost Comparison Summary
| Feature | NAT Gateway | Interface Endpoint | Gateway Endpoint |
|---|---|---|---|
| Hourly cost | $0.045/hour | ~$0.01/hour/AZ | FREE |
| Data processing | $0.045/GB | ~$0.01/GB | FREE |
| Supported services | Internet / AWS APIs | Most AWS services (ECR, CloudWatch, Secrets Manager, STS, SSM, KMS, SNS, etc.) | S3, DynamoDB only |
The key takeaway: Gateway Endpoints are free and should always be enabled for S3 and DynamoDB. Interface Endpoints cost money but are still 78% cheaper per GB than NAT Gateway. NAT Gateway should only handle traffic that genuinely needs to reach the public internet.
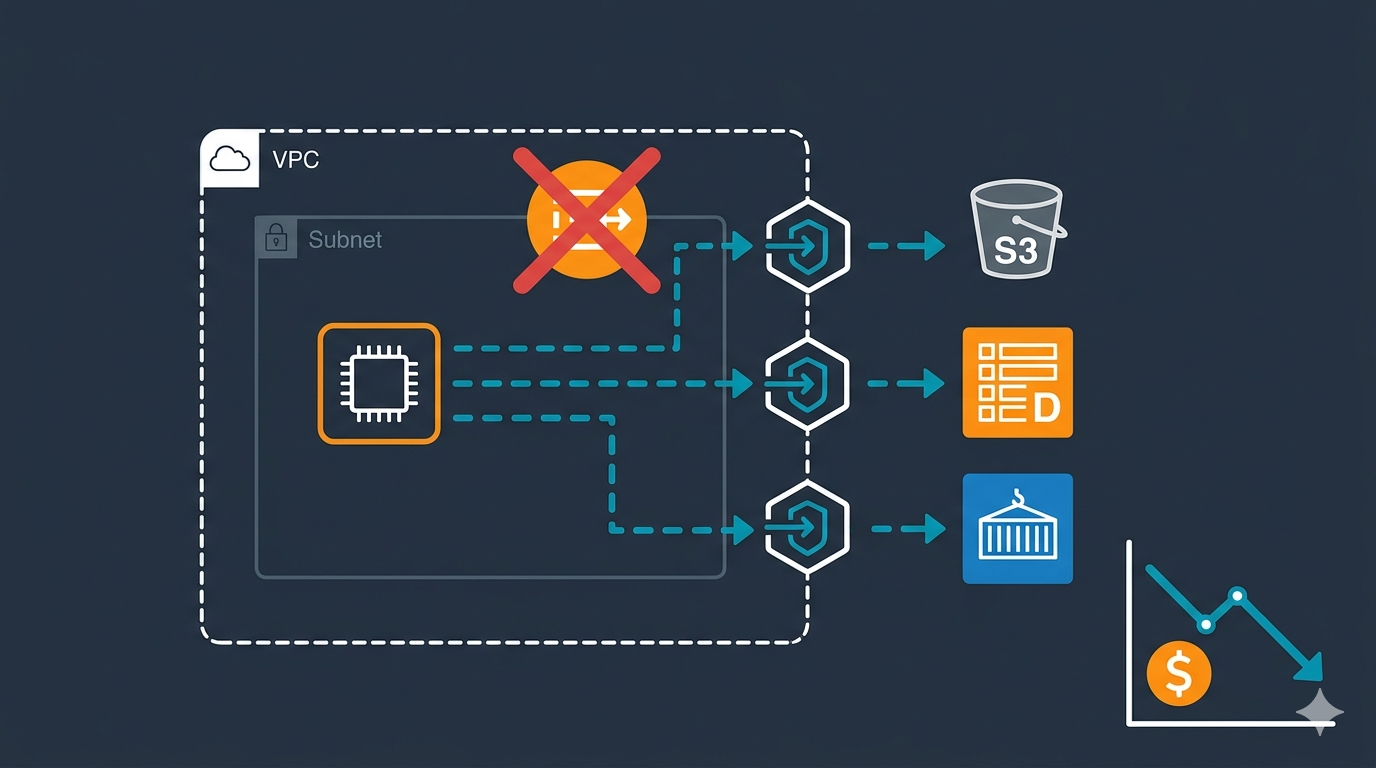
Architecture Example
Without VPC Endpoint:
Private Subnet --> NAT Gateway --> S3
                   Cost: $0.045/GB
With Gateway Endpoint:
Private Subnet --> Gateway Endpoint --> S3
                   Cost: $0
Without Interface Endpoint:
ECS Task --> NAT Gateway --> ECR (image pull)
             Cost: $0.045/GB
With Interface Endpoint:
ECS Task --> Interface Endpoint --> ECR (image pull)
             Cost: $0.01/GB (78% savings)
Common culprits that inflate your bill: Lambda functions writing to CloudWatch Logs, applications reading from S3, services calling DynamoDB, and ECS tasks pulling images from ECR. All of this traffic can bypass the NAT Gateway entirely using VPC Endpoints.
Step 1: Create an S3 Bucket for Flow Logs
Create a dedicated S3 bucket to store VPC Flow Logs. Use a descriptive name and enable server-side encryption.
aws s3api create-bucket \
  --bucket my-vpc-flowlogs-bucket \
  --region ap-southeast-1 \
  --create-bucket-configuration LocationConstraint=ap-southeast-1
Replace my-vpc-flowlogs-bucket with your preferred bucket name and ap-southeast-1 with your region. S3 bucket names must be globally unique.
Step 2: Enable VPC Flow Logs in Parquet Format
This is the most important step. Enable flow logs on the VPC you want to analyze, using Parquet format with Hive-compatible partitions. Parquet is 10-100x faster to query than plain text and uses about 20% less storage.
aws ec2 create-flow-logs \
  --resource-type VPC \
  --resource-ids vpc-0abc123def456789 \
  --traffic-type ALL \
  --log-destination-type s3 \
  --log-destination "arn:aws:s3:::my-vpc-flowlogs-bucket/vpc-flow-logs/" \
  --max-aggregation-interval 600 \
  --destination-options '{"FileFormat":"parquet","HiveCompatiblePartitions":true,"PerHourPartition":true}' \
  --log-format '${account-id} ${action} ${az-id} ${bytes} ${dstaddr} ${dstport} ${end} ${flow-direction} ${instance-id} ${interface-id} ${log-status} ${packets} ${pkt-dst-aws-service} ${pkt-dstaddr} ${pkt-src-aws-service} ${pkt-srcaddr} ${protocol} ${region} ${srcaddr} ${srcport} ${start} ${sublocation-id} ${sublocation-type} ${subnet-id} ${tcp-flags} ${traffic-path} ${type} ${version} ${vpc-id}' \
  --tag-specifications 'ResourceType=vpc-flow-log,Tags=[{Key=Name,Value=vpc-flowlogs-cost-analysis}]'
Key flags explained:
--traffic-type ALL— captures accepted, rejected, and skipped trafficFileFormat: parquet— columnar format that Athena queries efficientlyHiveCompatiblePartitions: true— creates S3 paths likeregion=us-east-1/year=2026/...so Athena discovers partitions automaticallyPerHourPartition: true— hourly partitions reduce the amount of data Athena scans per query--max-aggregation-interval 600— aggregates flows every 10 minutes (use60for 1-minute granularity on Nitro instances)pkt-src-aws-serviceandpkt-dst-aws-service— these fields identify whether traffic is going to S3, DynamoDB, ECR, or other AWS services, which is critical for VPC Endpoint planning
Replace vpc-0abc123def456789 with your actual VPC ID. You can find it with:
aws ec2 describe-vpcs --query 'Vpcs[*].{ID:VpcId,CIDR:CidrBlock,Name:Tags[?Key==`Name`].Value|[0]}' --output tableIf you are working with multiple VPCs and need help designing your subnet layout, the AWS VPC Subnet Planner tool can help you visualize your network architecture.
Verify Flow Logs Are Active
After creating the flow log, confirm it is active:
aws ec2 describe-flow-logs \
  --filter "Name=resource-id,Values=vpc-0abc123def456789" \
  --query 'FlowLogs[*].{ID:FlowLogId,Status:FlowLogStatus,Dest:LogDestination,Format:LogFormat}' \
  --output table
The status should show ACTIVE. Wait 10-15 minutes for the first log files to appear in S3, then give it 24-48 hours to collect enough data for meaningful analysis.
Step 3: Create an Athena Table with Partition Projection
Open the Athena Query Editor in the AWS Console and run the following query to create a table that maps to your Parquet flow logs in S3. Partition projection means Athena automatically discovers new partitions without you running MSCK REPAIR TABLE every day.
CREATE EXTERNAL TABLE IF NOT EXISTS vpc_flow_logs (
  version int,
  account_id string,
  interface_id string,
  srcaddr string,
  dstaddr string,
  srcport int,
  dstport int,
  protocol bigint,
  packets bigint,
  bytes bigint,
  start bigint,
  `end` bigint,
  action string,
  log_status string,
  vpc_id string,
  subnet_id string,
  instance_id string,
  tcp_flags int,
  type string,
  pkt_srcaddr string,
  pkt_dstaddr string,
  az_id string,
  sublocation_type string,
  sublocation_id string,
  pkt_src_aws_service string,
  pkt_dst_aws_service string,
  flow_direction string,
  traffic_path int
)
PARTITIONED BY (
  region string,
  day string,
  hour string
)
ROW FORMAT SERDE 'org.apache.hadoop.hive.ql.io.parquet.serde.ParquetHiveSerDe'
STORED AS INPUTFORMAT 'org.apache.hadoop.hive.ql.io.parquet.MapredParquetInputFormat'
OUTPUTFORMAT 'org.apache.hadoop.hive.ql.io.parquet.MapredParquetOutputFormat'
LOCATION 's3://my-vpc-flowlogs-bucket/vpc-flow-logs/AWSLogs/123456789012/vpcflowlogs/'
TBLPROPERTIES (
  "EXTERNAL" = "TRUE",
  "skip.header.line.count" = "0",
  "projection.enabled" = "true",
  "projection.region.type" = "enum",
  "projection.region.values" = "ap-southeast-1",
  "projection.day.type" = "date",
  "projection.day.range" = "2026/01/01,NOW",
  "projection.day.format" = "yyyy/MM/dd",
  "projection.hour.type" = "integer",
  "projection.hour.range" = "00,23",
  "projection.hour.digits" = "2",
  "storage.location.template" = "s3://my-vpc-flowlogs-bucket/vpc-flow-logs/AWSLogs/123456789012/vpcflowlogs/${region}/${day}/${hour}"
);
Replace 123456789012 with your AWS account ID, my-vpc-flowlogs-bucket with your bucket name, and ap-southeast-1 with your region. If you use multiple regions, add them as comma-separated values in projection.region.values.
Step 4: Identify What is Driving NAT Gateway Costs
Now the useful part. These Athena queries will show you exactly where your NAT Gateway money is going. Replace 10.0.1.50 in the queries below with your NAT Gateway’s private IP address. You can find it in the VPC Console under NAT Gateways, or with:
aws ec2 describe-nat-gateways \
  --query 'NatGateways[*].{ID:NatGatewayId,State:State,PrivateIP:NatGatewayAddresses[0].PrivateIp,SubnetId:SubnetId}' \
  --output table
Query 1: Find AWS Service Traffic (S3, DynamoDB, ECR)
This is the most important query. It shows which AWS services your VPC is reaching through the NAT Gateway instead of through VPC Endpoints. Each service listed here is a candidate for a VPC Endpoint that could eliminate that traffic cost.
SELECT
  pkt_dst_aws_service,
  flow_direction,
  COUNT(*) AS flow_count,
  SUM(bytes) AS total_bytes,
  ROUND(SUM(bytes) / 1073741824.0, 2) AS total_gb,
  ROUND(SUM(bytes) / 1073741824.0 * 0.045, 2) AS estimated_nat_cost_usd
FROM vpc_flow_logs
WHERE log_status = 'OK'
  AND pkt_dst_aws_service IS NOT NULL
  AND pkt_dst_aws_service != '-'
  AND day BETWEEN '2026/03/01' AND '2026/03/15'
GROUP BY pkt_dst_aws_service, flow_direction
ORDER BY total_bytes DESC;
If you see AMAZON or S3 at the top of the results, you are paying NAT Gateway rates for traffic that should be free through a Gateway Endpoint.
Query 2: Top External Destinations by Cost
Find out which external IP addresses and ports consume the most data through your NAT Gateway:
SELECT
  dstaddr,
  dstport,
  SUM(bytes) AS total_bytes,
  ROUND(SUM(bytes) / 1073741824.0, 2) AS total_gb,
  ROUND(SUM(bytes) / 1073741824.0 * 0.045, 2) AS estimated_nat_cost_usd
FROM vpc_flow_logs
WHERE log_status = 'OK'
  AND srcaddr = '10.0.1.50'
  AND dstaddr NOT LIKE '10.%'
  AND day BETWEEN '2026/03/01' AND '2026/03/15'
GROUP BY dstaddr, dstport
ORDER BY total_bytes DESC
LIMIT 25;
Query 3: Top Internal Sources Generating NAT Traffic
Find which internal IP addresses (ECS tasks, EC2 instances) are sending the most data through the NAT Gateway. This tells you which services to prioritize for VPC Endpoint routing.
SELECT
  pkt_srcaddr AS internal_source,
  instance_id,
  subnet_id,
  SUM(bytes) AS total_bytes,
  ROUND(SUM(bytes) / 1073741824.0, 2) AS total_gb,
  ROUND(SUM(bytes) / 1073741824.0 * 0.045, 2) AS estimated_nat_cost_usd
FROM vpc_flow_logs
WHERE log_status = 'OK'
  AND srcaddr = '10.0.1.50'
  AND pkt_srcaddr LIKE '10.%'
  AND day BETWEEN '2026/03/01' AND '2026/03/15'
GROUP BY pkt_srcaddr, instance_id, subnet_id
ORDER BY total_bytes DESC
LIMIT 25;
Cross-reference the subnet_id results with your VPC design to identify which subnets need VPC Endpoint route table entries. If you need a refresher on subnet planning, check out How to Design IP Addressing for Amazon VPC and Subnets.
Query 4: Traffic by Port (Identify Service Types)
SELECT
  dstport,
  CASE dstport
    WHEN 443 THEN 'HTTPS (S3, ECR, APIs)'
    WHEN 80 THEN 'HTTP'
    WHEN 5432 THEN 'PostgreSQL'
    WHEN 3306 THEN 'MySQL'
    WHEN 6379 THEN 'Redis'
    WHEN 27017 THEN 'MongoDB'
    ELSE CAST(dstport AS VARCHAR)
  END AS service_hint,
  COUNT(*) AS flow_count,
  SUM(bytes) AS total_bytes,
  ROUND(SUM(bytes) / 1073741824.0, 2) AS total_gb
FROM vpc_flow_logs
WHERE log_status = 'OK'
  AND srcaddr = '10.0.1.50'
  AND dstaddr NOT LIKE '10.%'
  AND day BETWEEN '2026/03/01' AND '2026/03/15'
GROUP BY dstport
ORDER BY total_bytes DESC;
Port 443 will almost always be the top result. That is because S3, ECR, CloudWatch, Secrets Manager, and most AWS API calls use HTTPS. This is why the AWS service query (Query 1) is so important — it breaks down port 443 traffic by actual service.
Query 5: Rejected Traffic (Security Group and NACL Blocks)
Rejected traffic still flows through the NAT Gateway and costs you money. This query shows what is being blocked:
SELECT
  srcaddr,
  dstaddr,
  dstport,
  action,
  COUNT(*) AS reject_count,
  SUM(bytes) AS total_bytes
FROM vpc_flow_logs
WHERE action = 'REJECT'
  AND day BETWEEN '2026/03/01' AND '2026/03/15'
GROUP BY srcaddr, dstaddr, dstport, action
ORDER BY reject_count DESC
LIMIT 25;
High reject counts from the same source IP often indicate port scanning, misconfigured services, or security group rules that need updating.
Step 5: Deploy VPC Endpoints to Eliminate NAT Charges
Based on your Athena query results, deploy VPC Endpoints for the AWS services that generate the most NAT traffic. Start with the free ones.
Gateway Endpoints: S3 and DynamoDB (Free)
Gateway Endpoints for S3 and DynamoDB are completely free — no hourly charge, no per-GB charge. There is no reason not to have these in every VPC. Traffic routed through a Gateway Endpoint bypasses the NAT Gateway entirely.
# Create S3 Gateway Endpoint
aws ec2 create-vpc-endpoint \
  --vpc-id vpc-0abc123def456789 \
  --service-name com.amazonaws.ap-southeast-1.s3 \
  --route-table-ids rtb-0aaa111bbb222ccc rtb-0ddd333eee444fff

# Create DynamoDB Gateway Endpoint
aws ec2 create-vpc-endpoint \
  --vpc-id vpc-0abc123def456789 \
  --service-name com.amazonaws.ap-southeast-1.dynamodb \
  --route-table-ids rtb-0aaa111bbb222ccc rtb-0ddd333eee444fff
Replace the route table IDs with the ones associated with your private subnets. Include every private subnet route table that has traffic going to S3 or DynamoDB. You can list your route tables with:
aws ec2 describe-route-tables \
  --filters "Name=vpc-id,Values=vpc-0abc123def456789" \
  --query 'RouteTables[*].{ID:RouteTableId,Associations:Associations[*].SubnetId}' \
  --output table
Interface Endpoints: ECR (For ECS and Container Workloads)
If you run ECS Fargate tasks or EKS pods, container image pulls go through the NAT Gateway by default. Setting up ECR Interface Endpoints routes this traffic privately and reduces your per-GB cost from $0.045 to $0.01.
You need three endpoints to fully route ECR traffic privately. Missing any one of these means image pulls still hit the NAT Gateway:
# ECR API endpoint (for authentication and image metadata)
aws ec2 create-vpc-endpoint \
  --vpc-id vpc-0abc123def456789 \
  --vpc-endpoint-type Interface \
  --service-name com.amazonaws.ap-southeast-1.ecr.api \
  --subnet-ids subnet-0aaa111 subnet-0bbb222 \
  --security-group-ids sg-0123456789 \
  --private-dns-enabled

# ECR Docker endpoint (for image layer downloads)
aws ec2 create-vpc-endpoint \
  --vpc-id vpc-0abc123def456789 \
  --vpc-endpoint-type Interface \
  --service-name com.amazonaws.ap-southeast-1.ecr.dkr \
  --subnet-ids subnet-0aaa111 subnet-0bbb222 \
  --security-group-ids sg-0123456789 \
  --private-dns-enabled

# S3 Gateway endpoint (REQUIRED — ECR stores image layers in S3)
aws ec2 create-vpc-endpoint \
  --vpc-id vpc-0abc123def456789 \
  --service-name com.amazonaws.ap-southeast-1.s3 \
  --route-table-ids rtb-0aaa111bbb222ccc
The security group (sg-0123456789) must allow inbound HTTPS (port 443) from your private subnets. If you are troubleshooting ECS tasks, you may also want to have ECS Exec enabled on your Fargate containers so you can shell into running tasks and verify DNS resolution for the endpoint.
Interface Endpoints: CloudWatch, Secrets Manager, and STS
If your Athena queries show significant traffic to CloudWatch or Secrets Manager, add these Interface Endpoints as well. Each one costs $0.01/hr per AZ plus $0.01/GB — still 78% cheaper than NAT Gateway per-GB rates.
# CloudWatch Logs
aws ec2 create-vpc-endpoint \
  --vpc-id vpc-0abc123def456789 \
  --vpc-endpoint-type Interface \
  --service-name com.amazonaws.ap-southeast-1.logs \
  --subnet-ids subnet-0aaa111 subnet-0bbb222 \
  --security-group-ids sg-0123456789 \
  --private-dns-enabled

# Secrets Manager
aws ec2 create-vpc-endpoint \
  --vpc-id vpc-0abc123def456789 \
  --vpc-endpoint-type Interface \
  --service-name com.amazonaws.ap-southeast-1.secretsmanager \
  --subnet-ids subnet-0aaa111 subnet-0bbb222 \
  --security-group-ids sg-0123456789 \
  --private-dns-enabled

# STS (for IAM role assumption in cross-account setups)
aws ec2 create-vpc-endpoint \
  --vpc-id vpc-0abc123def456789 \
  --vpc-endpoint-type Interface \
  --service-name com.amazonaws.ap-southeast-1.sts \
  --subnet-ids subnet-0aaa111 subnet-0bbb222 \
  --security-group-ids sg-0123456789 \
  --private-dns-enabled
The STS endpoint is especially useful if your services use cross-account AssumeRole or if you access Secrets Manager from another account. Each AssumeRole call goes through the NAT Gateway unless you have the STS endpoint.
Verify Your Endpoints
After creating all endpoints, verify they are available:
aws ec2 describe-vpc-endpoints \
  --filters "Name=vpc-id,Values=vpc-0abc123def456789" \
  --query 'VpcEndpoints[*].{ID:VpcEndpointId,Service:ServiceName,State:State,Type:VpcEndpointType}' \
  --output table
All endpoints should show available in the State column.
Step 6: Measure the Impact
After deploying VPC Endpoints, wait a few days and re-run Query 1 (AWS Service Traffic). The services you created endpoints for should show dramatically reduced or zero traffic through the NAT Gateway.
You can also compare total NAT Gateway data processing before and after:
-- Compare daily NAT Gateway traffic: before vs after endpoints
SELECT
  day,
  ROUND(SUM(bytes) / 1073741824.0, 2) AS total_gb,
  ROUND(SUM(bytes) / 1073741824.0 * 0.045, 2) AS estimated_cost_usd
FROM vpc_flow_logs
WHERE log_status = 'OK'
  AND srcaddr = '10.0.1.50'
  AND dstaddr NOT LIKE '10.%'
  AND day BETWEEN '2026/03/01' AND '2026/03/31'
GROUP BY day
ORDER BY day;
You should see a clear drop in daily traffic volume after the date you deployed the endpoints.
If you want to visualize these query results over time, Amazon QuickSight connects directly to Athena and can turn your flow log queries into dashboards with traffic trends, cost breakdowns by service, and subnet-level charts. For more flexibility, you can also build your own visualization app that reads from the Athena query results in S3 — useful if you want a custom internal tool tailored to your team’s workflow.
Quick Reference: VPC Endpoint Checklist
Here is a summary of which endpoints to deploy based on your workload:
| If You Use | Deploy These Endpoints | Type | Cost |
|---|---|---|---|
| S3 (any access) | com.amazonaws.REGION.s3 |
Gateway | Free |
| DynamoDB | com.amazonaws.REGION.dynamodb |
Gateway | Free |
| ECS/EKS with ECR | ecr.api + ecr.dkr + S3 Gateway |
Interface + Gateway | $0.01/hr + $0.01/GB |
| CloudWatch Logs | com.amazonaws.REGION.logs |
Interface | $0.01/hr + $0.01/GB |
| CloudWatch Metrics | com.amazonaws.REGION.monitoring |
Interface | $0.01/hr + $0.01/GB |
| Secrets Manager | com.amazonaws.REGION.secretsmanager |
Interface | $0.01/hr + $0.01/GB |
| Cross-account AssumeRole | com.amazonaws.REGION.sts |
Interface | $0.01/hr + $0.01/GB |
| Systems Manager / SSM | com.amazonaws.REGION.ssm |
Interface | $0.01/hr + $0.01/GB |
Conclusion
NAT Gateway costs are fixable once you have visibility. Enable VPC Flow Logs in Parquet format, create an Athena table with partition projection, and run a few queries to see where your money goes. Then deploy Gateway Endpoints for S3 and DynamoDB (free) and Interface Endpoints for ECR, CloudWatch, and other high-traffic services. Most teams see a 40-80% reduction in NAT Gateway data processing charges within the first week.
If your VPC has overlapping CIDR ranges that complicate endpoint routing, check out Handling IP Address Overlapping in Network Connections. For monitoring your AWS infrastructure after these changes, setting up Datadog on your instances gives you real-time visibility into network throughput and can alert you if NAT traffic spikes again.