If your application sends logs to Datadog but they show up as a single unparsed string, you’re missing out on filtering, alerting, and building dashboards on the actual data inside those logs. Grok parsing rules let you extract structured fields from raw log lines so Datadog can treat them as searchable attributes. This guide shows you how to parse custom logs in Datadog using Grok rules, with real examples for JSON and list-wrapped JSON formats.
Already running a Datadog Agent on your EC2 instance? Good — that means your logs are already flowing into Datadog. The problem is that custom application logs often come in as unstructured text, which makes them hard to work with. Grok parsing fixes that.
Why Parse Your Logs
When logs arrive in Datadog unparsed, you get one big message string. You can search it with wildcards, but that’s about it. Once you parse logs into structured attributes, you can:
- Filter logs by specific field values (e.g.
@DeletedObject.changeFlag:DELETED) - Build monitors that alert on specific conditions
- Create dashboard widgets that aggregate parsed fields
- Correlate log data across services using shared IDs
The difference between “searching through raw text” and “querying structured data” is huge when you’re debugging at 2 AM.
The Log Format Problem
Here’s the situation. Your application logs deletion events and the log lines look like this:
Format 1: JSON Wrapped in a List
Received deleted object: [{"eventId": 1234567890, "subscriptionId": 11223344, "portalId": 55667788, "objectId": 9876543210, "changeFlag": "DELETED"}]Format 2: Plain JSON Object
Received deleted object: {"eventId": 1234567890, "subscriptionId": 11223344, "portalId": 55667788, "objectId": 9876543210, "changeFlag": "DELETED"}Both formats contain the same data — eventId, subscriptionId, portalId, objectId, and changeFlag. The only difference is that the first one wraps the JSON in square brackets. You’ll run into this when different parts of your application (or different library versions) serialize the same data slightly differently.
Without parsing, Datadog treats the entire line as a single message string. You can’t filter by objectId or alert when changeFlag equals DELETED — it’s all just text.
Setting Up Grok Parsing in Datadog
Grok parsing happens in Log Pipelines. You create a pipeline, add a Grok Parser processor to it, and write rules that match your log format. Here’s the step-by-step.
Step 1: Create a Log Pipeline
Go to Logs > Configuration > Pipelines in Datadog. Click New Pipeline. Give it a name that describes the log source — something like “Deletion Event Logs”. Set a filter query so this pipeline only processes the relevant logs. For example:
source:your-app-nameThis keeps the pipeline scoped to just the logs you want to parse, so it doesn’t interfere with other log sources.
Step 2: Add a Grok Parser Processor
Inside your new pipeline, click Add Processor and select Grok Parser. You’ll need to write parsing rules that handle both log formats. Here’s where the actual Grok rules come in.
Step 3: Write the Grok Parsing Rules
Add these two rules in the Grok Parser. The order matters — Datadog tries each rule from top to bottom and uses the first one that matches.
Rule 1 — matches the list-wrapped JSON format:
rule_list Received deleted object: \[%{data:DeletedObject:json}\]Rule 2 — matches the plain JSON format:
rule_plain Received deleted object: %{data:DeletedObject:json}Let me break down what’s happening here:
rule_listandrule_plain— these are just rule names so you can identify them in DatadogReceived deleted object:— the literal text prefix before the JSON data\[and\]— escaped square brackets that match the list wrapper in Format 1%{data:DeletedObject:json}— this is the core pattern. It captures everything into an attribute namedDeletedObjectand tells Datadog to parse it as JSON
The :json matcher is important. Without it, Datadog captures the JSON as a raw string instead of expanding it into individual fields. With it, you get DeletedObject.eventId, DeletedObject.changeFlag, and all the other nested attributes automatically.
Step 4: Test Your Rules
Before saving, paste one of your sample log lines into the test box. Datadog shows you the parsed output in real time so you can verify the attributes are extracted correctly. Test both formats to make sure each rule matches the right one.
Parsed Output Result
After your Grok rules are applied, Datadog transforms the raw log line into structured attributes. Here’s what the parsed output looks like in the Log Explorer — the JSON fields are now individual, searchable attributes under DeletedObject:
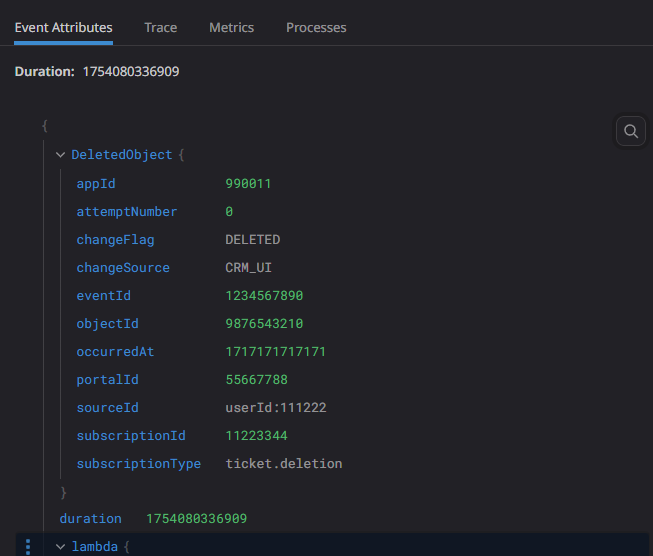
What you should see in the parsed attributes panel:
| Attribute | Value |
|---|---|
@DeletedObject.eventId | 1234567890 |
@DeletedObject.subscriptionId | 11223344 |
@DeletedObject.portalId | 55667788 |
@DeletedObject.objectId | 9876543210 |
@DeletedObject.changeFlag | DELETED |
Each attribute is now a facet you can use in searches, monitors, and dashboards. Before parsing, this was all buried in one big message string. Now you can run queries like @DeletedObject.changeFlag:DELETED and get instant results.
Using Parsed Attributes for Monitoring
Once your logs are parsed, here are some practical things you can do with the structured data:
Filter logs by specific values — In the Log Explorer, search for @DeletedObject.objectId: to find all deletion events for a specific object. This is way faster than doing wildcard searches on raw text.9876543210
Create a monitor — Set up a log monitor that triggers when the count of logs with @DeletedObject.changeFlag:DELETED exceeds a threshold within a time window. Useful for catching unexpected mass deletions.
Build dashboard widgets — Create a timeseries widget that counts deletion events over time, grouped by @DeletedObject.portalId. This gives you visibility into which portals are seeing the most activity.
If you’re also monitoring Lambda functions that process these events, check out Setting Up Datadog Monitoring for Containerized AWS Lambda Functions to get full observability across your pipeline.
Tips for Writing Grok Rules
A few things I’ve learned from working with Grok parsers in Datadog:
- Put the more specific rule first. Datadog tries rules top-to-bottom. If the generic rule matches before the specific one, you’ll get unexpected results. In our case, the list-wrapped rule goes first because the plain JSON rule would also partially match the list format.
- Always use the test box. Paste real log samples before saving. It’s easy to miss an escaped character or whitespace issue that only shows up with actual data.
- Name your attributes carefully. Whatever you put after
data:becomes the attribute name in Datadog. Use consistent naming across pipelines so your dashboards and monitors stay clean. - Use the
:jsonmatcher for JSON data. If you skip it and just use%{data:DeletedObject}, you’ll capture the JSON as a string. The:jsonsuffix tells Datadog to expand it into nested attributes.
Conclusion
Grok parsing rules are one of those Datadog features that take a few minutes to set up but save you a lot of time down the line. Once your custom logs are parsed into structured attributes, filtering, alerting, and dashboarding all become straightforward. The key is writing rules that match your actual log formats — and testing them with real samples before going live.
If you haven’t set up the Datadog Agent yet, start with How to Install Datadog Agent with Apache2 on EC2 Ubuntu 22.04. And if your logs are coming from Lambda functions, setting up Datadog monitoring for containerized Lambda is a good next step.